
Ninety-four percent of content marketing teams now use AI. Only 19% track any AI-specific KPIs. That gap between adoption and accountability is where real money leaks out of B2B content operations, and almost nobody is measuring it correctly.
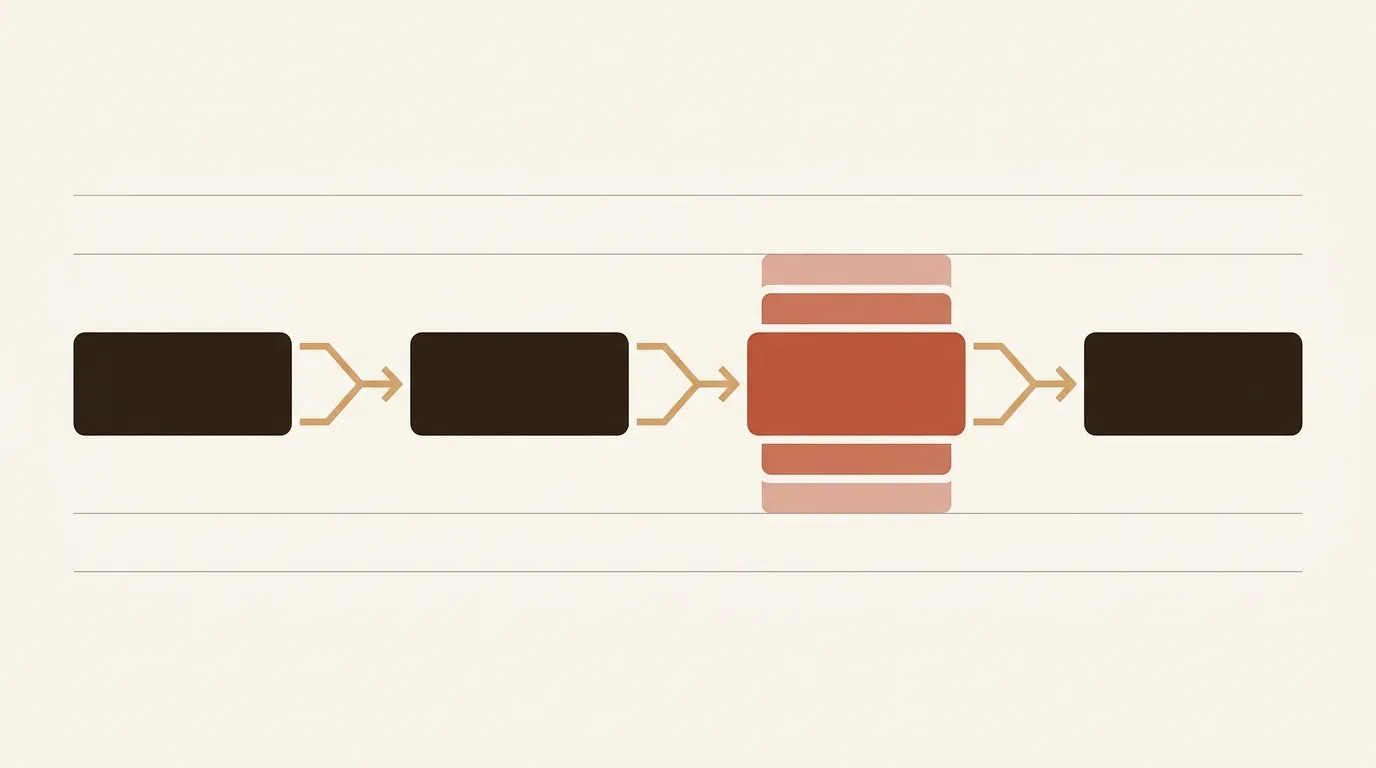
Most teams benchmark their AI investment against what they saved on writing. Cheaper drafts, faster turnaround, fewer freelancer invoices. Fair enough. But writing costs were never the bottleneck. The expensive, invisible work happens after the draft exists: keyword validation, internal linking, quality scoring, metadata optimization, schema markup, attribution tagging. That operational layer between "draft" and "ranking signal" is where per-article budgets quietly bleed out, and it's where the competitive separation will happen over the next 12 months.
We've built a stage-by-stage cost model below, along with a single-number benchmark (a "lifecycle efficiency score") that tells you exactly how much operational waste sits in your current workflow.
The $7.65 Benchmark Is Misleading Without Context
Content marketing's average ROI of $7.65 per dollar spent gets cited everywhere. And SEO specifically delivers 748% ROI with a 7-to-9-month breakeven, making it the highest-returning B2B marketing channel available. These numbers are real. They're also averages that obscure a brutal variance.
Here's what the averages hide: only 13% of B2B marketers report that their content strategy significantly improved ROI, while 48% report only modest gains. And across all industries, roughly 25% of AI initiatives deliver expected ROI. Three out of four AI bets underperform.
That 25% figure matters because it tells you something specific. The teams hitting their ROI targets aren't the ones who adopted AI first or spent the most. They're the ones who built operational infrastructure around their AI outputs. The draft is the easy part. Everything after the draft is where the 75% failure rate lives.
Where Your Per-Article Budget Actually Goes
We've tracked this across dozens of content workflows, and the pattern is remarkably consistent. A typical B2B blog post that costs $250 to $400 all-in breaks down roughly like this:
Draft generation: 25-35% of total cost. This is the part everyone automates first. AI writing tools, whether ChatGPT, Jasper, Writer, or pipeline-based systems, have compressed this to near-zero marginal cost for many teams. Call it $10-50 per article depending on your setup.
Research and fact-checking: 15-20% of total cost. Topic research, competitive analysis, source validation. Some of this can be automated, but most teams still do it manually or skip it entirely (which shows up later as thin content that doesn't rank).
The operational middle layer: 40-55% of total cost. This is the part that kills you. It includes keyword validation against search intent, internal link insertion and anchor text optimization, meta title and description writing, schema markup, readability scoring, brand voice consistency checks, image alt text, and publication formatting. On a 2-person marketing team publishing 8-12 posts per month, this layer eats 15-25 hours of labor. That's a part-time hire's worth of work that produces no creative value.
Publication and distribution: 5-10% of total cost. CMS formatting, scheduling, social promotion setup. Relatively small, but it adds up at scale.
The ratio is striking. Teams that automated drafting but left the operational layer manual reduced their content costs by maybe 30%. Teams that automated the operational layer too reduced costs by 60-70%, and (more importantly) saw consistency improvements that compounded into better rankings over time.
The Three Automation Touchpoints That Return the Most Margin
Not all operational steps are equally expensive or equally automatable. After mapping out dozens of workflows, three specific touchpoints consistently return the highest margin when automated.
Internal Linking at Scale
This one is almost comically undervalued. Manual internal link maintenance across hundreds of published articles requires significant dev time, and most small teams simply don't do it. They add two or three internal links per new post, miss opportunities in older content, and never revisit link structures after publication.
Automated internal linking systems can scan your entire content library, identify topical clusters, enforce consistent anchor text policies, and update thousands of pages after a single rule change. The ROI here isn't subtle. Internal links directly influence crawl depth, page authority distribution, and topical authority signals. A site with 200 posts and poor internal linking is leaving 20-40% of its potential organic traffic on the table. We've seen this pattern repeat enough to be confident in that range.
The time savings alone justify it: what takes a human 3-5 minutes per link (finding the right target page, choosing anchor text, checking for duplicate links) takes an automated system milliseconds. Across 10 links per article and 50 articles per month, that's 25-40 hours saved.
Pre-Publication SEO Quality Scoring
Automated pre-publication scoring systems analyze readability, keyword usage, heading structure, and technical SEO elements before content goes live. This sounds basic, but the consistency effect is enormous.
A human editor catches maybe 80% of optimization issues on a good day. On a rushed Friday afternoon with three posts in the queue, that drops to 50-60%. An automated quality gate catches 95%+ every time. No variance, no fatigue, no "I forgot to check the meta description."
The math on this is straightforward. If inconsistent optimization means 1 in 5 posts publishes under-optimized, and under-optimized posts generate 30-50% less organic traffic over their lifetime, you're burning 6-10% of your total content investment on preventable errors. For a team spending $3,000/month on content, that's $180-300/month in wasted potential. Not dramatic in isolation, but it compounds over 12 months into meaningful traffic gaps.
Metadata Generation
Meta titles and descriptions are tedious. They have strict character limits, need to include target keywords, should be compelling enough to drive clicks, and every single article needs them. Most content teams treat metadata as an afterthought, writing it in the last 30 seconds before hitting publish.
Automated metadata generation, when it's tuned to your brand voice and SEO targets, produces consistently optimized metadata in seconds. The click-through rate impact of well-optimized metadata versus hastily written metadata is typically 15-25% (based on Ahrefs and Semrush split-test data we've reviewed). On a post getting 500 impressions per month, that's 75-125 extra clicks. Per post. Per month. Forever.
Why Your AI Investment Probably Isn't Delivering
IBM's 2026 analysis identified a specific reason most AI initiatives underperform: teams never baselined what they were starting from. They adopted AI tools, saw some productivity gains, and couldn't demonstrate the financial delta because they had no "before" measurement.
This is genuinely hard to fix retroactively. But it explains why only 41% of marketers can confidently point to improved ROI from their AI efforts even though 79% report productivity gains. Productivity and profitability are not the same thing. You can produce content 3x faster and still lose money if that content doesn't rank, doesn't convert, or costs more in post-production labor than you saved in writing.
The fix isn't complicated, but it requires discipline. You need a single metric that captures total lifecycle efficiency, not just draft speed.
How to Calculate Your Lifecycle Efficiency Score
Here's the formula. It's deliberately simple because complex metrics don't get tracked.
Lifecycle Efficiency Score (LES) = Automated Baseline Time ÷ Your Actual Time × 100
The "automated baseline time" represents the theoretical minimum time from completed draft to published, fully optimized post if every operational step were automated. For most B2B blog content, this baseline is approximately 8-12 minutes (automated keyword validation, internal linking, quality scoring, metadata generation, image optimization, CMS formatting, and scheduling).
Your "actual time" is how long these same steps take your team today. Track it honestly for 10 posts. Include the time spent on revisions triggered by missed optimization steps.
Interpreting your score:
- LES above 80: You're running a tight operation. Marginal gains only.
- LES 50-80: Meaningful automation opportunities exist. Focus on the three touchpoints above.
- LES 30-50: Your operational layer is consuming more budget than your content creation. This is where most 1-3 person teams land.
- LES below 30: You're essentially running a manual workflow with AI drafting bolted on. The draft speed savings are being eaten by post-production labor.
Most teams we've talked to score between 25 and 45. That's not a criticism; it's the natural result of adopting AI writing tools without rethinking the surrounding workflow.
The AI Search Variable Nobody's Budgeting For
One more factor that changes the operational math significantly: AI Overviews now appear on 48% of Google queries as of April 2026, reaching 2 billion monthly users. That's up from 31% in February 2025, a 58% increase in just over a year.
This matters for operational workflows because AI search visibility has different optimization requirements than traditional SEO. 44.2% of LLM citations come from the first 30% of an article's text, and content with statistics sees 28-40% higher visibility in AI search results.
So your operational checklist just got longer. Stat placement in opening paragraphs, structured data for AI parsability, concise answer formatting for featured snippets. Teams without automated quality gates for these new requirements are optimizing for a search engine that's already changing underneath them.
This is genuinely messy territory. Nobody has definitive best practices for AI search optimization yet, and anyone claiming otherwise is selling something. But the operational burden is real and growing, which makes the case for automated quality scoring even stronger.
A Single Number to Justify Your Next Investment
Ninety-five percent of marketers plan to increase their AI investment in the next 12 months. The question isn't whether to invest. It's where.
If your LES is below 50, the highest-return investment isn't a better AI writer. It's operational automation: internal linking, quality scoring, and metadata generation. These three touchpoints alone can move a team from an LES of 35 to an LES of 70+, recovering 15-20 hours per month of labor and eliminating the optimization inconsistencies that silently cap your organic traffic ceiling.
Calculate your score this week. Track it monthly. The number will tell you more about your content operation's health than any dashboard full of vanity metrics ever could.
References
- Content Marketing Institute, "B2B Content and Marketing Trends: Insights for 2026" -- https://contentmarketinginstitute.com/b2b-research/b2b-content-marketing-trends-research
- Averi, "State of AI in Marketing (2026): 7 Trends Reshaping the Industry" -- https://www.averi.ai/blog/the-state-of-ai-content-marketing-2026-benchmarks-report
- G2, "AI in B2B Marketing: Where the Real Advantage Lies in 2026" -- https://learn.g2.com/ai-in-b2b-marketing
- IBM, "How to maximize AI ROI in 2026" -- https://www.ibm.com/think/insights/ai-roi
- MarTech, "How to drive real ROI with AI in B2B marketing" -- https://martech.org/how-to-drive-real-roi-with-ai-in-b2b-marketing/