A sustainable 2-posts-per-week cadence outperforms an unsustainable 5-posts-per-week sprint when optimized for 12-month consistency, according to 2026 content calendar data from Digital Applied. That single finding should make every B2B content manager uncomfortable, because most teams still measure success by how many posts they ship per month.
We've watched this pattern play out for years. A team ramps up output, celebrates a traffic bump in month two, then watches organic performance plateau by month five. The posts are live, but the pipeline behind them is fractured. And fractured pipelines don't compound.
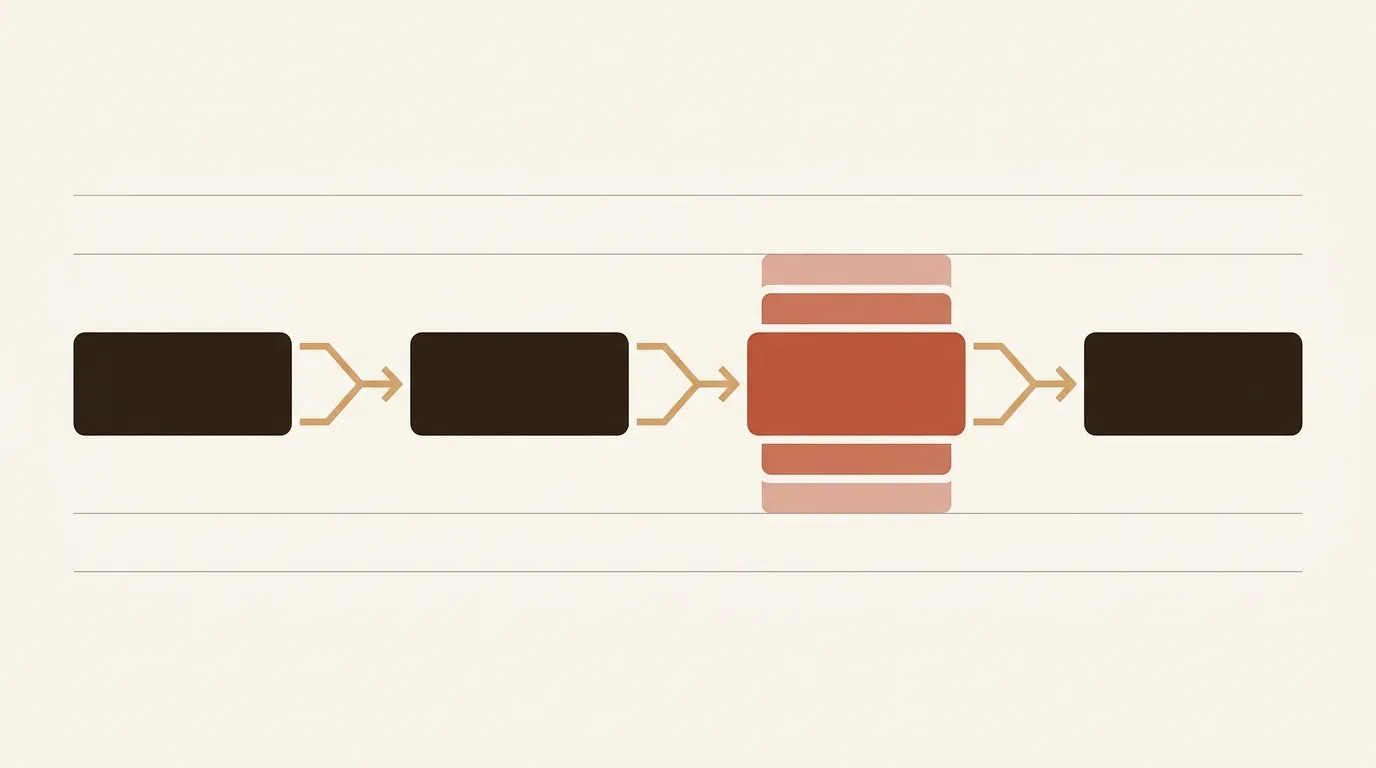
The real performance lever isn't cadence. It's integration depth, the number of functional connections between stages in your content workflow that actually work without human babysitting. We built a scorecard to measure it, and the diagnostic number it produces tells you exactly which broken connection is costing you compounding returns.
The Volume Trap: Why 3x/Week Loses to 1x/Week
The math seems obvious. More posts equals more indexed pages equals more organic traffic. But the 2026 data tells a different story.
Companies maintaining 9+ posts monthly achieve 35.8% year-over-year traffic growth, which sounds like a volume argument until you look at what "maintaining" actually means. These aren't teams throwing drafts at WordPress and hoping for the best. They're running coordinated workflows where keyword validation, briefing, internal linking, quality scoring, and content refreshes all happen in a predictable sequence.
A content calendar without a workflow is a wishlist. That line from Market-code's 2026 planning guide nails it. Each row in your editorial calendar needs to move through a repeatable pipeline from idea to publish, with explicit owners and quality gates. Without that, you're just scheduling chaos.
Here's what happens when teams prioritize volume over integration: they publish 12 posts in a month, but 4 of them target keywords with zero business intent, 3 have no internal links to existing content clusters, and 2 go live without proper meta descriptions because the SEO review step got skipped during the rush. The per-post organic yield drops to near zero on half the output, and the team has spent the same budget they would have on 6 fully integrated posts.
The compounding threshold, the point at which your content library starts generating exponential rather than linear returns, varies by domain authority and niche competition. But it always, always depends on workflow integrity.
Domain Authority Changes the Equation
Not all publishing cadences are created equal because not all domains start from the same position.
Roughly 53.3% of all website traffic comes from organic search, which means your domain authority directly determines how much inbound pipeline each post can generate. A DR-45 site publishing one tightly integrated post per week will outperform a DR-15 site publishing three posts per week, even if the lower-authority site's content is objectively better.
The inflection point matters. Crossing DR 30 represents a structural shift in competitive strength, with domains above that threshold experiencing 3.2X higher click-through rates from search results. Below DR 30, your content is essentially invisible for competitive keywords regardless of how many posts you publish.
So the first question isn't "how often should we publish?" It's "what's our domain authority, and does our pipeline include the link-building and topical authority steps needed to move it?" A team at DR 18 should be spending 40% of their content budget on linkable assets and distribution, not on volume. A team at DR 55 can afford to focus on filling topical gaps because their existing authority will carry new posts into rankings faster.
This is genuinely messy to plan for. The logarithmic nature of domain authority means it's much easier to move from DA 15 to 30 than from 50 to 60, and your publishing strategy should reflect where you sit on that curve.
The Pipeline Integration Scorecard
We built this scorecard after auditing dozens of B2B content operations. Five connections matter. Each scores 0 to 20 points. Your total tells you where you are, and more importantly, which single connection is most likely broken.
Connection 1: Keyword Validation Handoff (0-20 points)
Every piece of content should pass through structured validation before anyone writes a word. Research, keyword validation, and competitive gap analysis should be owned by a strategist, producing a vetted topic with primary keyword, search intent, and business angle.
Score yourself honestly. If your writers pick their own keywords from a brainstorm doc, that's a 5. If you have a formal validation step with documented criteria (search volume thresholds, intent classification, competitive gap data), and it runs before every brief gets created, that's a 15-20.
Teams skipping this handoff publish 30-50% more content that generates zero organic traffic. We've seen it repeatedly. The post gets written, gets published, and sits on page 7 forever because nobody checked whether the keyword was winnable.
Connection 2: Briefing Completeness (0-20 points)
A brief should be detailed enough that the writer can produce a draft without follow-up questions: angle, audience, outline, required sources, tone guide, CTA, and internal link targets. All in one document.
The failure mode here is subtle. Incomplete briefs don't stop production; they slow it. Every back-and-forth message between editor and writer adds 1-2 days to time-to-publish. Over 50 posts, that's 50-100 lost days of content sitting in review instead of ranking.
Score a 20 if your briefs are templatized, contain all seven elements listed above, and fewer than 10% of drafts require structural revisions. Score a 5 if "the brief" is a Slack message with a keyword and a deadline.
Connection 3: Internal Linking Automation (0-20 points)
This is the connection most teams ignore, and it's the one with the most immediate ROI impact.
Each pillar page should anchor 8-15 supporting posts with deliberate internal links. Isolated articles do not rank effectively anymore. Google's systems increasingly reward topical clusters, and internal links are how you signal cluster membership.
Manual internal linking processes fail at scale. When the responsibility falls on the writer or editor to "add a few internal links," adoption drops 60-70%. The links either don't get added, or they get added randomly without regard to cluster architecture.
Score a 20 if internal link targets are assigned during the briefing stage, verified before publication, and audited monthly for broken or missing connections. Score a 0 if nobody on your team can tell you how many internal links your last 10 posts contain.
Connection 4: Quality Scoring Triggers (0-20 points)
Rankings and traffic are lagging indicators. By the time you see a post underperforming in Search Console, it's been live for 3-6 months and the opportunity cost is enormous.
Leading indicators catch drift early. Track briefs shipped per week, internal links added per post, average time-to-publish, and content score at publication. If any of these metrics deviate more than 15% from your baseline, something in the pipeline is breaking.
The best teams we've seen trigger automated SEO audits after publication and feed those insights back into future briefs. That feedback loop turns your content operation into a learning system rather than a production line.
Connection 5: Refresh Capacity Allocation (0-20 points)
Allocating 15-25% of weekly capacity to updating existing posts is non-negotiable in 2026. With AI-generated SERP volatility, refresh cycles have tightened from 18 months to 6-8 months, and teams that only publish new content are watching their back catalog decay.
Regularly updating older content boosts organic traffic by 28%. That's not a rounding error. For a site generating 50,000 monthly organic visits, a 28% lift from refreshes alone is worth more than dozens of new posts targeting low-volume keywords.
Score a 20 if refresh is a scheduled, staffed activity with its own capacity allocation. Score a 0 if "updating old posts" is something your team talks about in quarterly planning and never actually does.
What Your Score Means for ROI
Add up your five connection scores. The total maps to a predictable ROI band based on 2026 B2B content marketing benchmarks.
80-100: Integrated pipeline. You're in position for the 748% average content marketing ROI that top-performing B2B companies report. Your bottlenecks are visible and fixable. AI tooling spend is generating measurable per-post yield.
60-79: Partial integration. Expect 400-500% ROI with noticeable friction. One missing connection is costing you 20-30% in organic yield per post. Most teams we talk to land here, usually because internal linking or refresh allocation is the weak link.
40-59: Broken downstream. Publishing velocity is masking workflow chaos. Your writers are productive, but the content isn't compounding because it's not connected to anything. Expect 150-250% ROI. Anything less than tracking status, owner, primary keyword, cluster, channel, CTA, repurpose plan, and success metric is a list, not a system.
Below 40: Ad-hoc publishing. AI tooling spend is largely wasted here. Without workflow orchestration, even the best AI-generated content produces sub-200% ROI with declining returns over time. Fix the pipeline before buying more tools.
The Single Missing Connection That Costs the Most
Across the teams we've audited, two broken connections appear more than any others.
The most common: ideation, briefing, and QA happen on different tempos than writing. Strategy meets on Monday, briefs go out on Wednesday, drafts come back the following Tuesday, and QA doesn't happen until someone remembers. The article approved on Thursday could be queued for design on Friday and published by Monday, but instead it sits in a review queue for 8 days. Multiply that by 20 posts per month and you've lost 160 days of potential ranking time annually.
The second most common: no automation connecting internal linking targets to published content. Links get assigned in the brief, forgotten during writing, partially added during editing, and never audited post-publish. The topical cluster strategy that looked great in the spreadsheet never materializes on the actual site.
Closing one broken connection typically unlocks 15-25% more organic yield per post within 60 days. That's not a projection; it's a pattern we've observed consistently.
The Compounding Math Over 24 Months
B2B SaaS companies typically reach break-even on SEO investment within 7 months, with full ROI materializing over 2-3 years. Companies that prioritize blogging are 13x more likely to report positive SEO ROI.
But that 13x multiplier has a prerequisite: pipeline integration. The compounding effect requires that each new post strengthens existing posts through internal links, that refresh cycles maintain the value of older content, and that every post targets a validated keyword with real business intent.
A team publishing one fully integrated post per week (52 posts per year) with a pipeline score above 80 will outperform a team publishing three partially integrated posts per week (156 posts per year) with a score below 60. By month 18, the gap is usually 2-3x in organic traffic, and the cost-per-post for the integrated team is lower because rework and waste are minimized.
So, run the scorecard. Be honest about each connection. And instead of asking "how do we publish more?" ask "which connection do we fix first?" That question will do more for your organic traffic than any increase in publishing cadence.
References
- How to Plan a B2B Content Calendar in 2026 - Market-code
- Content Calendar Template 2026: Strategy and Planning - Digital Applied
- Write Once, Publish Everywhere: The 2026 Playbook for Multi-Channel Content - FlowDevs
- Content Marketing ROI Benchmarks for B2B SaaS (2026 Data) - Averi
- 38 B2B SEO Statistics and Organic Search Trends for 2026 - GTM 80/20