Seventy-four percent of B2B content marketers have integrated AI into their workflows. Only 19% track any AI-specific KPIs. That gap isn't a rounding error. It's the difference between teams that know what AI is doing for them and teams running on vibes and velocity dashboards.
We've spent the last two years watching content teams celebrate cost-per-article reductions while their organic pipelines flatline. The celebration is premature. Cost-per-article, the metric that dominates every AI tool pitch deck and every marketing Slack channel, captures less than 15% of the true economic lifecycle of a blog post. And the teams building their 2026 budgets around it are optimizing for the wrong thing entirely.
The Metric Everyone Loves (and Why It Lies)
Cost-per-article is seductive because it's instant. You know the number before the post goes live. If you were paying a freelancer $500 per post and now an AI workflow produces a comparable draft for $12 in API costs plus 45 minutes of human editing, you can walk into a budget meeting with a 90%+ cost reduction. Executives love that story.
But the story ends at publication. And that's the problem.
A blog post published today won't generate its first qualified pipeline touchpoint for months. SEO delivers 748% ROI, the highest of any B2B marketing channel, but that number assumes you survive the lag. B2B SaaS companies hit breakeven at roughly 7 months, with most businesses seeing meaningful returns in the 7-to-9-month window. Between publication and that breakeven point, you're spending. Not earning. Not breaking even. Spending.
Cost-per-article says nothing about this. It's like evaluating a rental property based on the cost of the front door.
Two Camps Are Forming
We're seeing B2B content teams split into two distinct measurement camps, and the divide will define who wins organic market share in 2026.
Camp 1: Generation efficiency. These teams measure outputs per hour, cost per draft, time from brief to published post. They've gotten fast. Some are producing 4x the content they did 18 months ago at a fraction of the cost. Their dashboards look fantastic in week one.
Camp 2: Indexation-to-revenue lag. These teams measure the elapsed time and compounding cost between publication and the moment a post generates its first qualified pipeline touchpoint. They track refresh cycles, organic session value over 24 months, and the financing cost of capital deployed to content that won't return revenue for half a year or more.
Camp 1 is bigger. Camp 2 is right.
The distinction matters because the two camps make radically different budget decisions. A Camp 1 team might publish 200 posts in Q1, declare victory, and then panic in Q3 when pipeline attribution shows most of those posts generated negligible revenue. A Camp 2 team might publish 60 posts, allocate budget for refresh cycles in months 6 and 12, and outperform on cumulative organic revenue by month 18.
What Happens Between Month 0 and Month 9
This is the part nobody wants to talk about in AI content marketing, so we will.
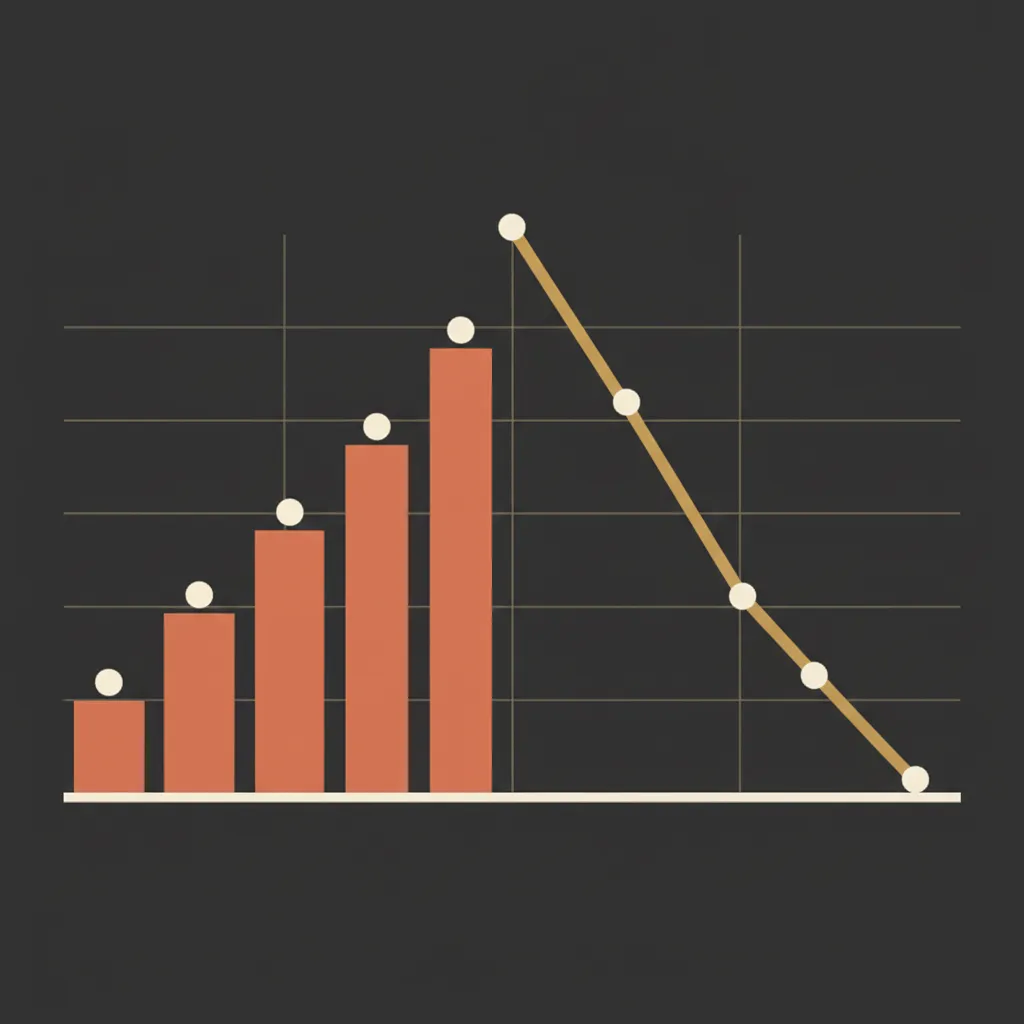
Between publication and the 6-to-12-month mark, a blog post goes through a predictable (and expensive) lifecycle that cost-per-article completely ignores. Initial indexation takes 1 to 4 weeks. Google's crawl budget, your site's authority, and internal linking structure all affect this. Posts on low-authority domains can sit unindexed for weeks. That's not free time; that's capital deployed to an asset generating zero return.
Then comes the ranking acceleration phase, months 2 through 7. Between the 6-month and 12-month mark is where SEO really kicks into gear, with content aging into authority, keywords climbing into top positions, and Google extending more trust to the domain. But during this acceleration phase, you're still in the red. Every post published in month 1 is accumulating holding cost, the opportunity cost of the money you spent on production that could have been deployed elsewhere.
And that's before we factor in refresh cycles. Content published in January needs updating by July or August, minimum. Google's freshness signals, competitive SERP movement, and factual accuracy all demand it. A post that cost $50 to generate and $80 in human QA time will need another $40-60 in refresh effort within 12 months. The true production cost just doubled, and cost-per-article never saw it coming.
The 81% Problem
Here's what makes this genuinely messy. 81% of B2B marketers now use generative AI tools, up from 72% the prior year. Adoption is near-universal. But only 13% of marketers with a content strategy report significant improvement in results and ROI. Forty-eight percent report modest gains. Thirty percent say performance is flat. Eight percent say it declined.
That's a 81% adoption rate producing a 13% success rate. The gap is not about the tools. The gap is about measurement.
Teams that don't track AI-specific KPIs can't distinguish between "we published more" and "we earned more." They conflate velocity with value. And because cost-per-article is the easiest AI metric to calculate, it becomes the default proof point. "We reduced content costs by 70%!" Great. Did revenue go up? Silence.
We are not saying AI content tools are failing. We're saying the measurement frameworks around them are failing. The 81% of content teams not tracking AI-specific KPIs are flying without instruments. They'll figure it out eventually, but "eventually" is an expensive word.
Cost Per Compounding Asset: A Better Benchmark
We've been building toward a metric we think should replace cost-per-article as the primary benchmark for content teams in 2026. We're calling it cost per compounding asset (CPCA), and it factors in the full 24-month economic lifecycle of a blog post.
The calculation has four components.
Total production cost includes draft generation, QA overhead, design, and publishing infrastructure, amortized across the asset. If you're paying for an AI writing tool, a human editor, a designer for the cover image, and CMS hosting, all of those costs contribute. For a typical SMB team using AI for first drafts with human review, we estimate the real total production cost per post lands between $80 and $200, not the $12 in API costs that appears on the AI vendor's marketing page.
Refresh and maintenance burden accounts for the updates required to maintain rankings over 24 months. Our rough benchmark: budget 30-50% of original creation cost per year for refresh. A post that cost $150 to produce needs $45-75 in annual maintenance. Over 24 months, total production cost is now $240-300.
Expected organic session value is a conservative estimate of organic traffic multiplied by assumed conversion rate multiplied by customer lifetime value, discounted to present value. This is where the compounding magic happens. After 12-18 months, content can earn 3-5x the traffic of month one while the monthly retainer stays flat. A post generating 500 organic sessions per month at a 2% conversion rate and $5,000 average deal value produces $50,000 in annual pipeline contribution. Against a $300 total production cost, that's a 166:1 return. But only if you measure across 24 months.
Attribution lag cost is the financing cost of waiting 7-9 months for revenue to materialize. For a bootstrapped startup, this is real cash flow pressure. For a funded company, it's opportunity cost. Either way, it belongs in the calculation.
CPCA = (Total Production + 24-Month Refresh) / (24-Month Organic Session Value - Attribution Lag Cost)
A ratio below 0.05 means the asset is a strong performer. Above 0.15, and you're likely better off with paid channels for that topic.
Why This Changes Budget Conversations
CPCA forces three questions that cost-per-article never asks.
First: is the expected 24-month organic revenue sufficient to justify the upfront production cost plus QA overhead? Some topics have enough search volume and commercial intent to clear this bar easily. Others don't. Cost-per-article treats a $12 post targeting a zero-volume keyword the same as a $12 post targeting a 5,000-monthly-search transactional term. CPCA doesn't.
Second: which content types have the highest ratio of expected organic lifetime value to total production cost? We've seen comparison posts and integration guides outperform thought leadership pieces by 8-12x on this metric. That's actionable information for editorial planning that cost-per-article can never provide.
Third: how does the effective cost per lead compare across channels when you account for the full 24-month funnel? Paid search gives you instant attribution. Organic gives you compounding returns. The right answer depends on your cash position, your planning horizon, and your willingness to wait. CPCA makes that tradeoff explicit.
The QA Overhead Everyone Underestimates
One more thing that cost-per-article buries. Forty-five percent of B2B marketers lack a scalable content creation model, and the bottleneck is almost never draft generation. It's quality assurance.
AI reduces first-draft time dramatically. We've seen 40-60% reductions consistently across different tools and use cases. But editing and review time often increases by 15-30% because AI drafts introduce new categories of error: hallucinated statistics, subtly wrong claims, tone inconsistencies, and structural patterns that trip Google's helpful content signals. If AI cuts draft time by 40% but increases review time by 25%, the net efficiency gain is 15%. Not 40%. The cost-per-article calculation that uses the 40% figure is lying to you.
Teams that skip human review to maximize the cost-per-article number tend to see quality degradation within 3-6 months. Rankings slip. Bounce rates climb. And the compounding asset they thought they were building turns out to be a depreciating one.
What This Means for Small Teams Making Budget Decisions Now
If you're a 1-3 person marketing team deciding how to allocate your 2026 content budget, here's what we'd actually recommend.
Stop reporting cost-per-article to your leadership. Replace it with a monthly report that shows cumulative organic sessions per content cohort (grouped by publication month), estimated pipeline contribution per cohort at the 6, 12, and 18-month marks, and QA overhead as a percentage of total production cost. These three numbers tell a more honest story than any cost-per-article figure ever will.
Build refresh costs into your production budget from day one. Don't treat content updates as a separate initiative. Every post you publish today needs maintenance in 6-12 months. Budget for it now or watch your compounding assets decay into liabilities.
And track your indexation-to-revenue lag explicitly. Measure the elapsed time between publication and first qualified pipeline touchpoint by content cluster and keyword intent. This number will vary wildly, from 3 months for high-intent bottom-of-funnel content to 12+ months for top-of-funnel thought leadership. Both are fine. But you need to know which is which before you decide where to invest.
The Question Worth Sitting With
We don't have a clean ending for this one because the problem isn't solved yet. The industry is converging on a measurement framework, but we're not there. CPCA is our best current attempt, and it's imperfect. Attribution modeling is still messy. Organic session value estimates carry wide confidence intervals. And the 7-9 month breakeven timeline assumes consistent publishing cadence, which 45% of B2B teams can't maintain.
What we do know: cost-per-article had its moment, and that moment is over. The teams that figure out how to measure the full lifecycle, including the unglamorous months between publication and payoff, will build the compounding advantages that no velocity metric can replicate. Everyone else will keep celebrating $12 blog posts that never earn a dollar back.
References
- B2B Marketing ROI Benchmarks 2026: What Actually Works (And What Doesn't) -- Data-Mania, LLC
- Content Marketing ROI 2026: Only 19% Track AI KPIs -- Digital Applied
- SEO ROI Statistics 2026: Analysis & Industry Benchmarks -- UpGrowth
- B2B Digital Marketing Benchmarks 2026: ROI Metrics & Results -- Martal Group
- B2B Content Marketing Strategy 2026 -- Geisheker Group